HistoveryData
ROLE
Lead Designer
TIMELINE
Nov 2023 - Jan 2024
OVERVIEW
Empowering cultural institutions and maintenance staff to leverage insights from visitor data.
TASK
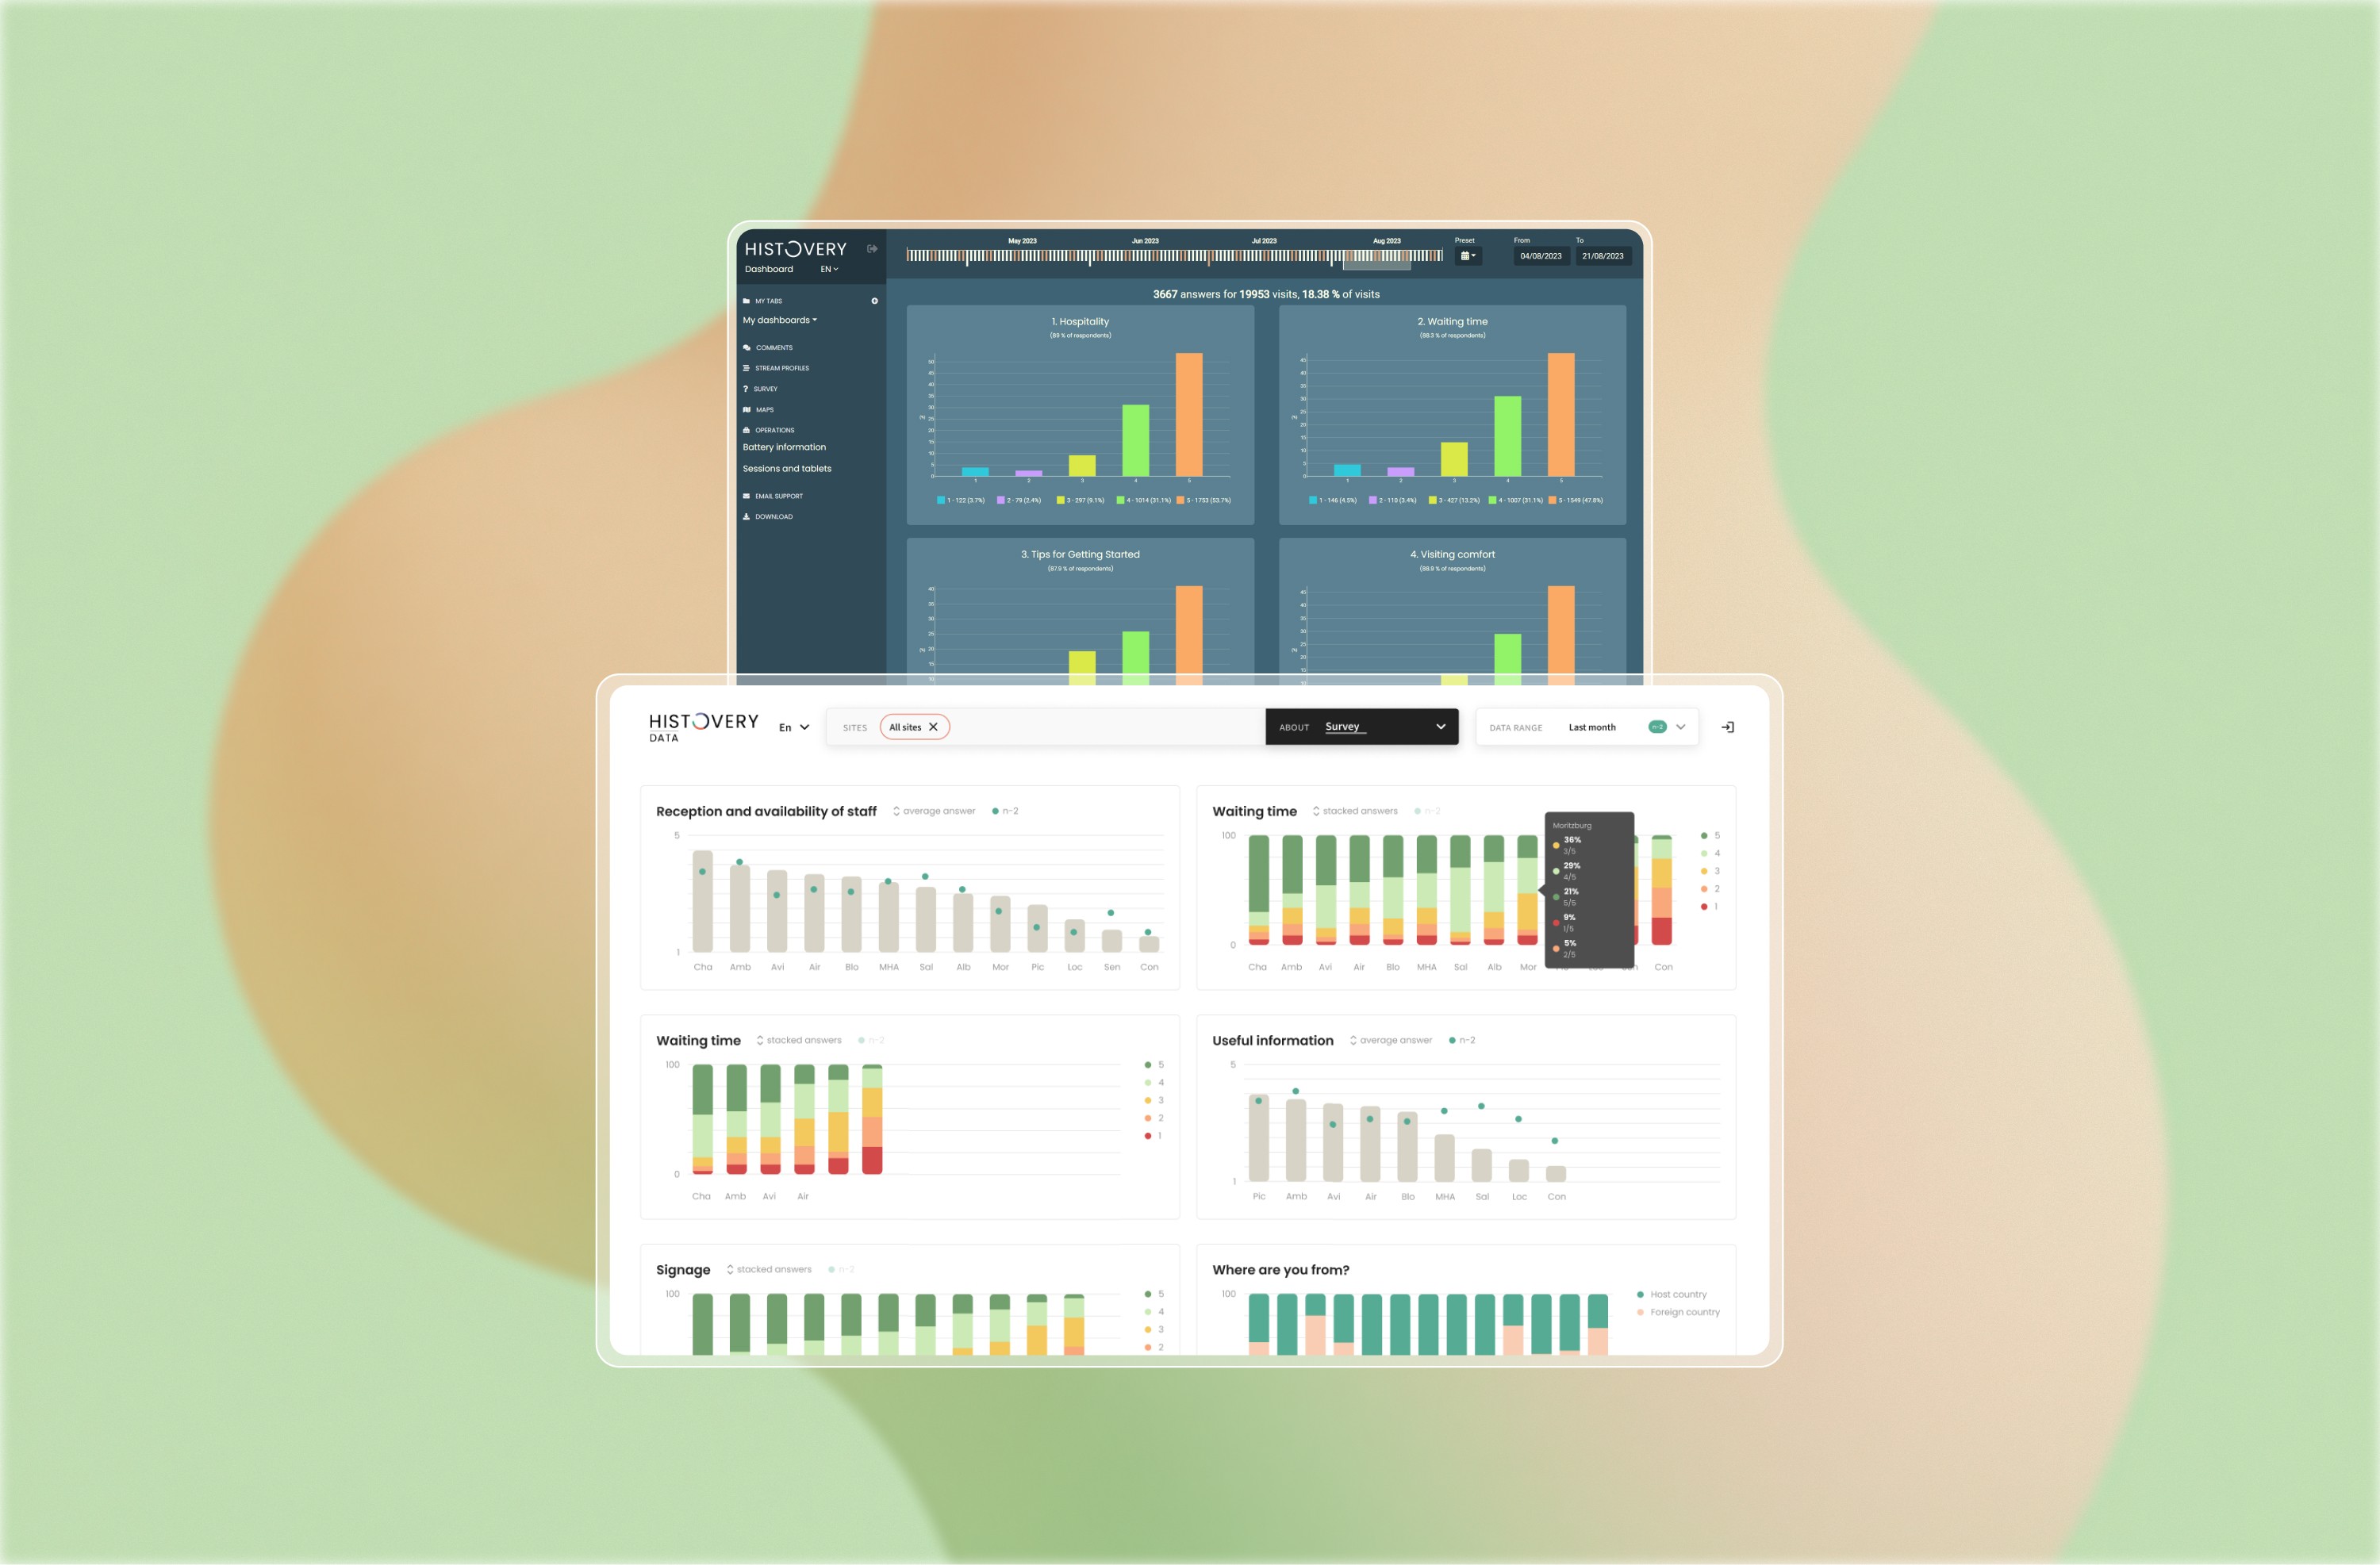
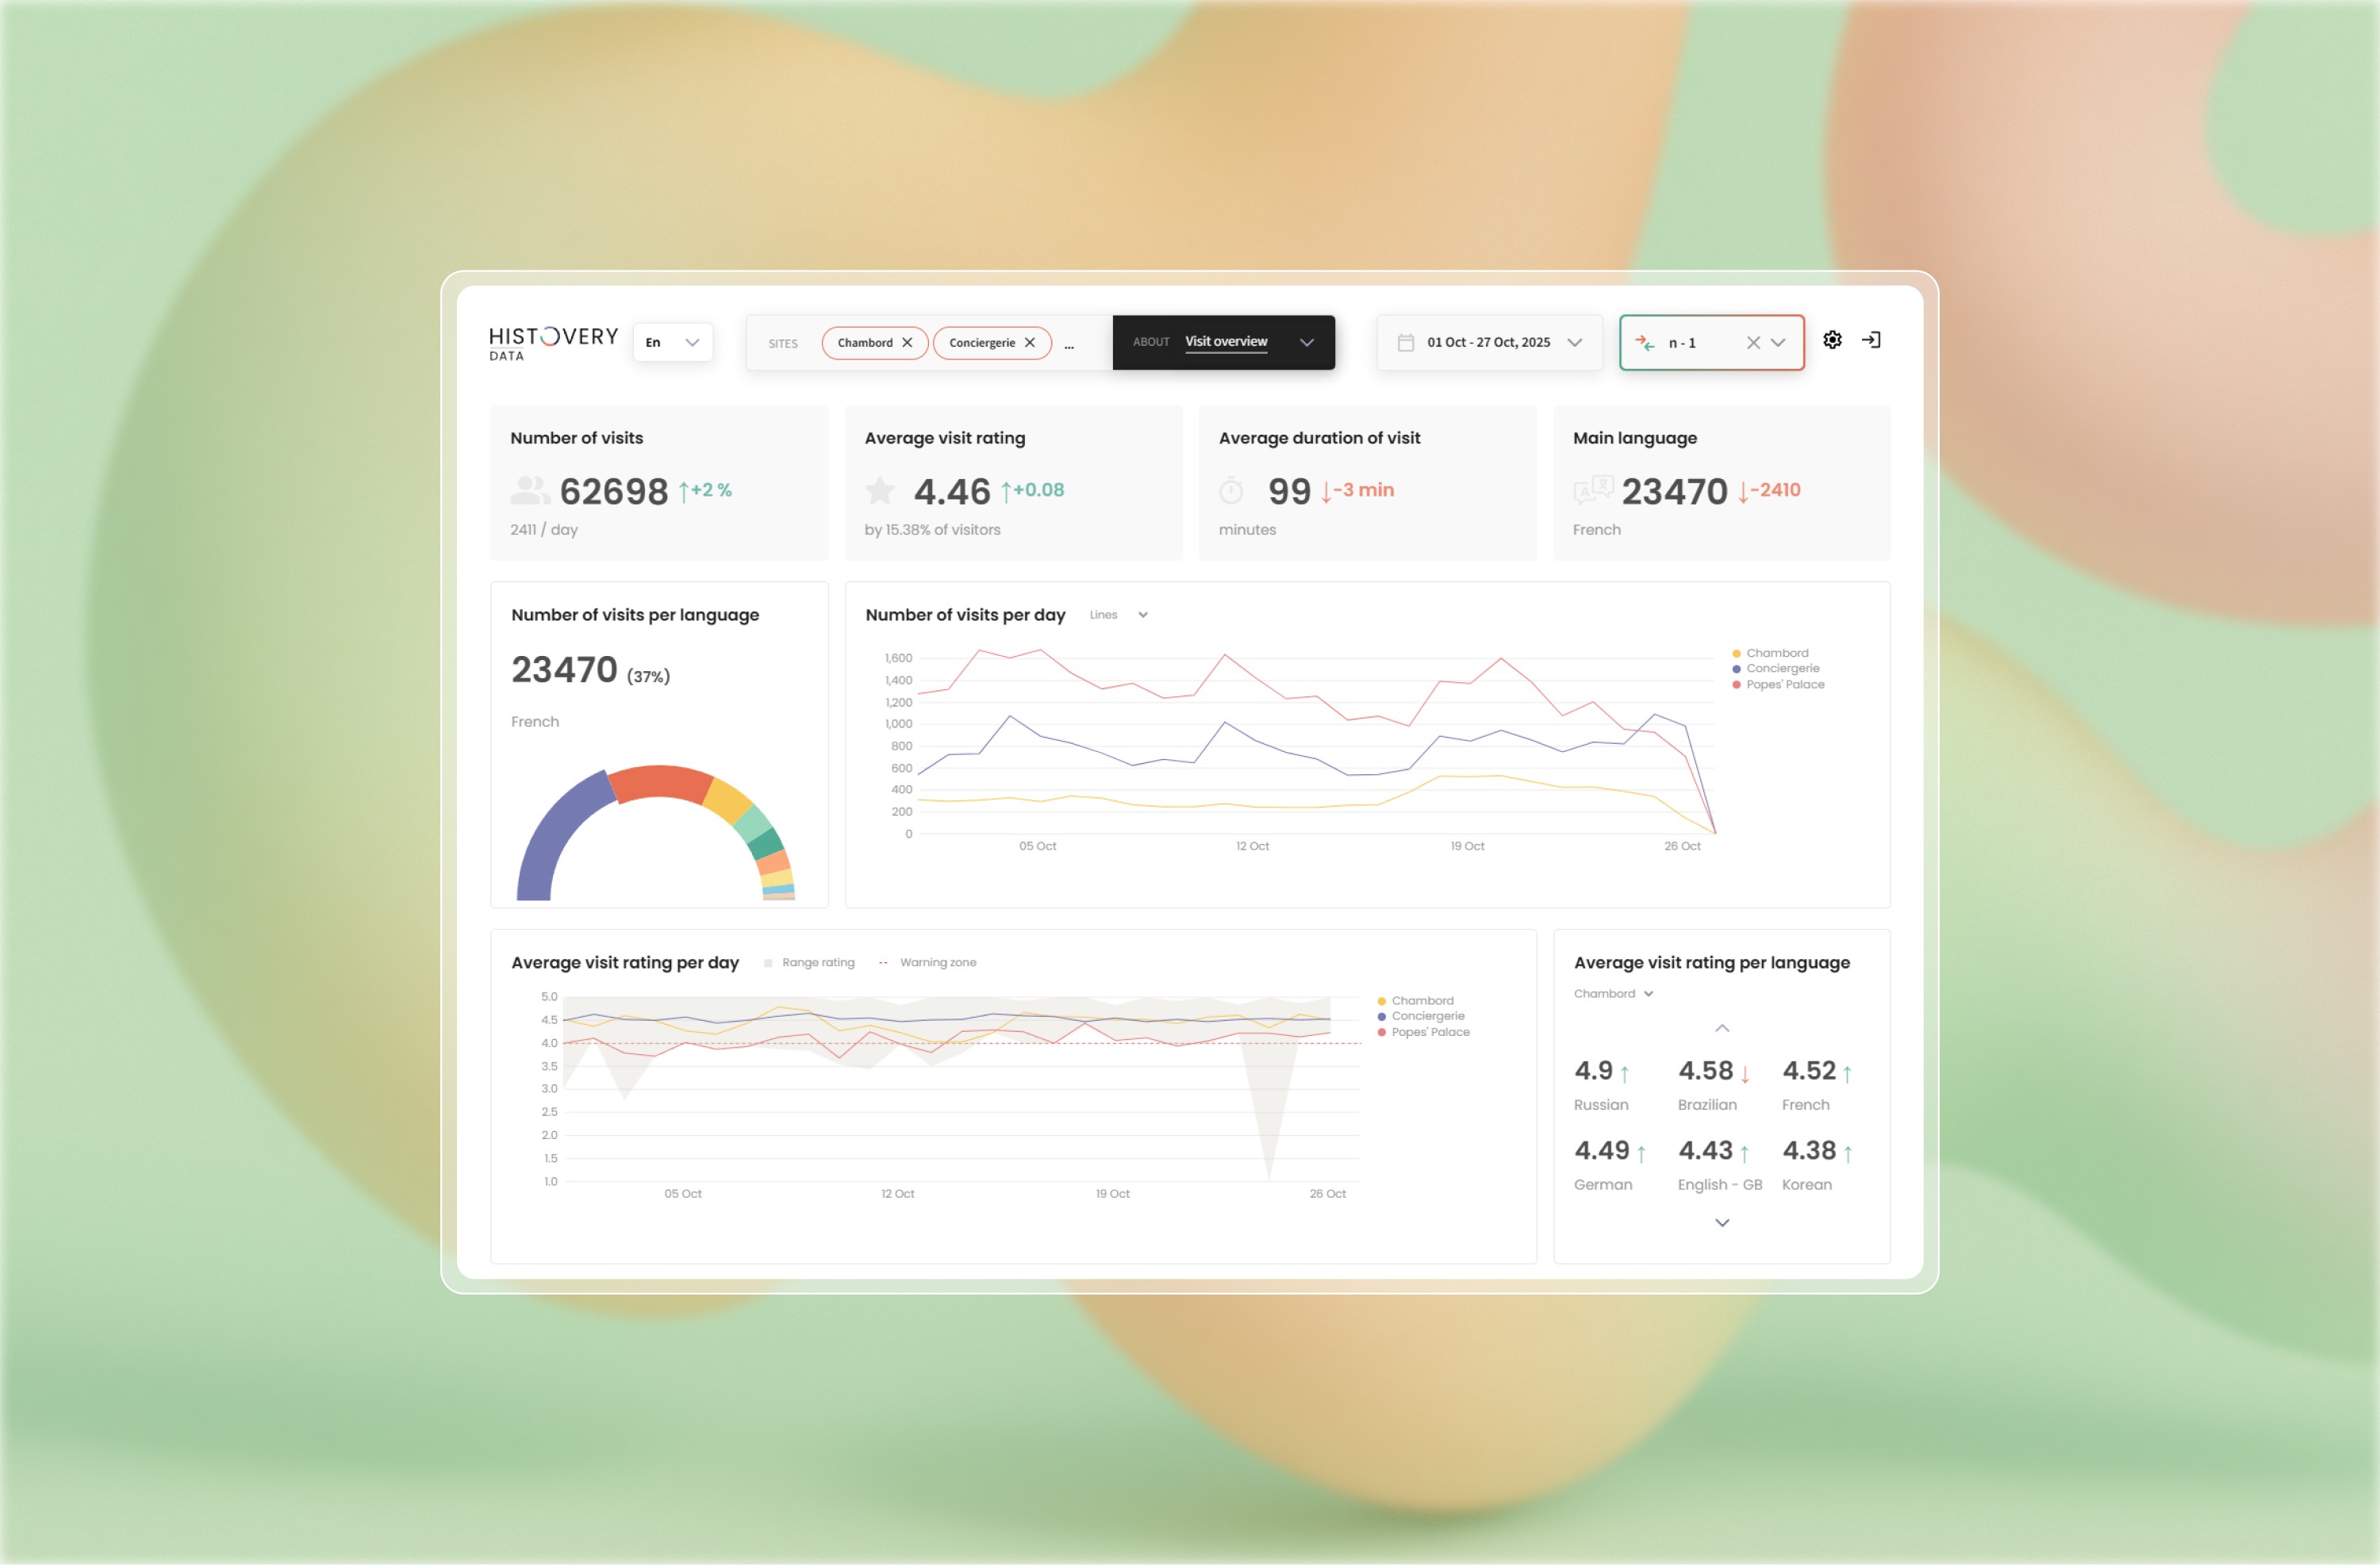
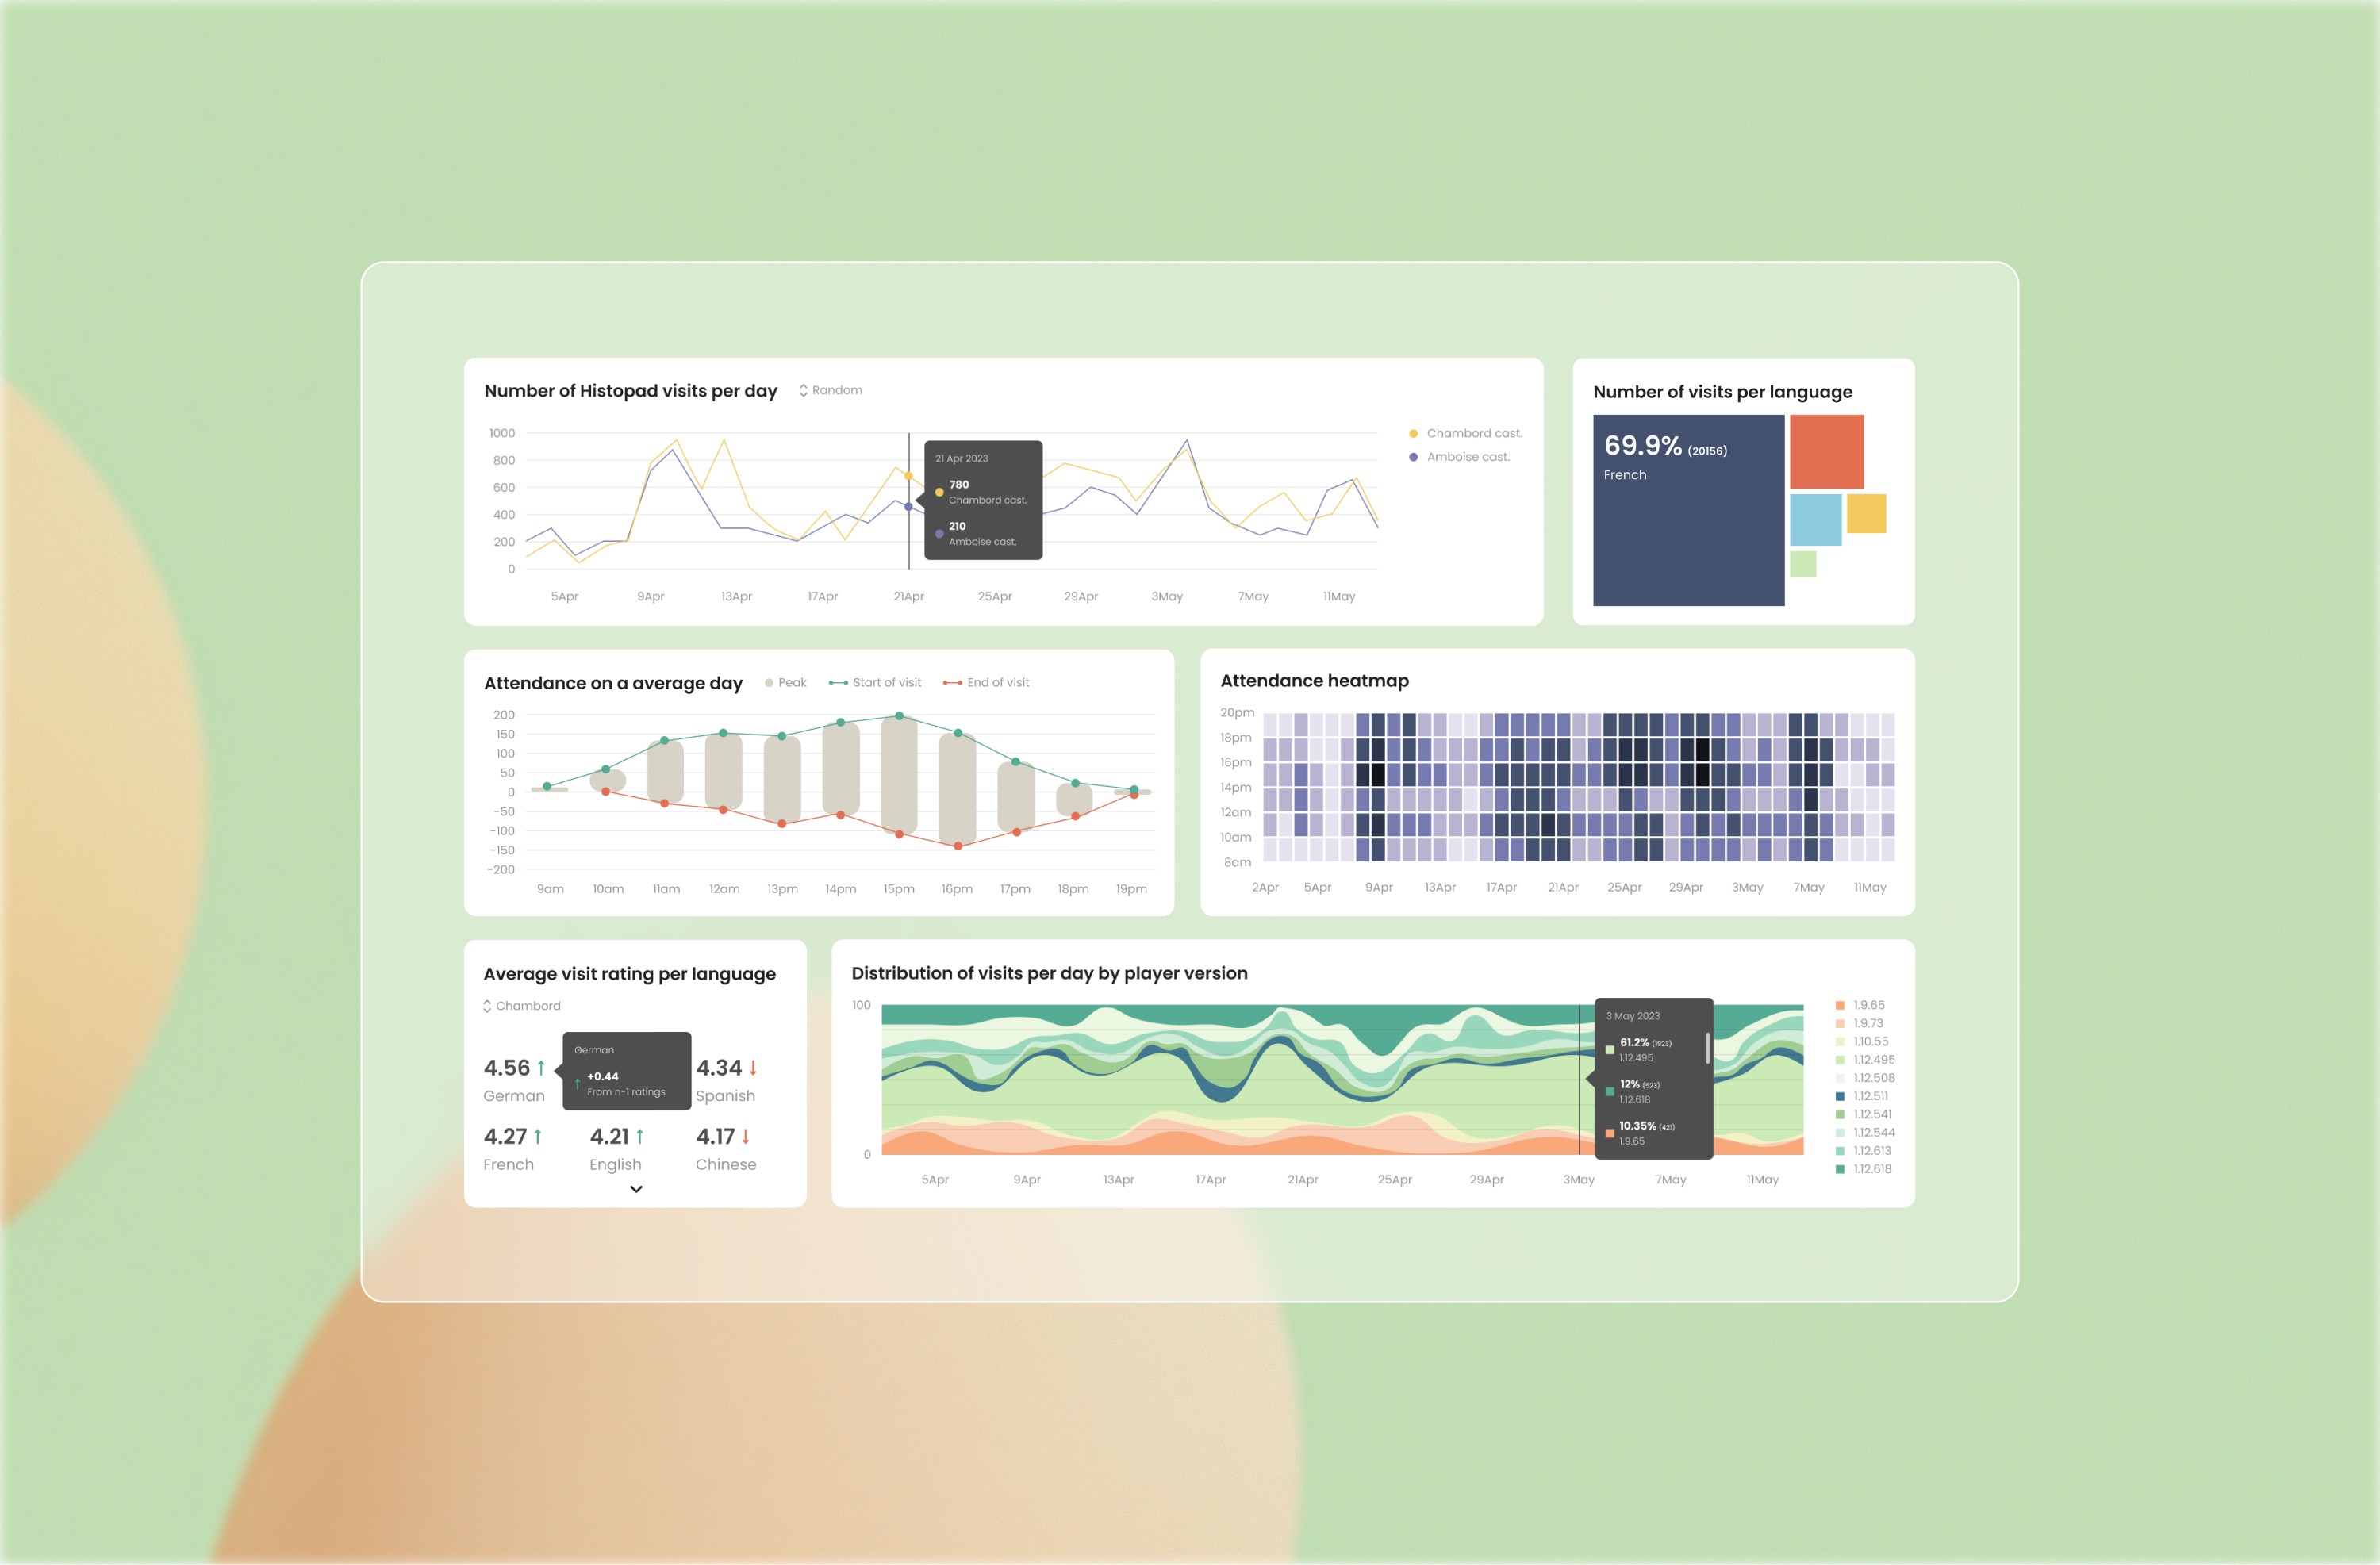
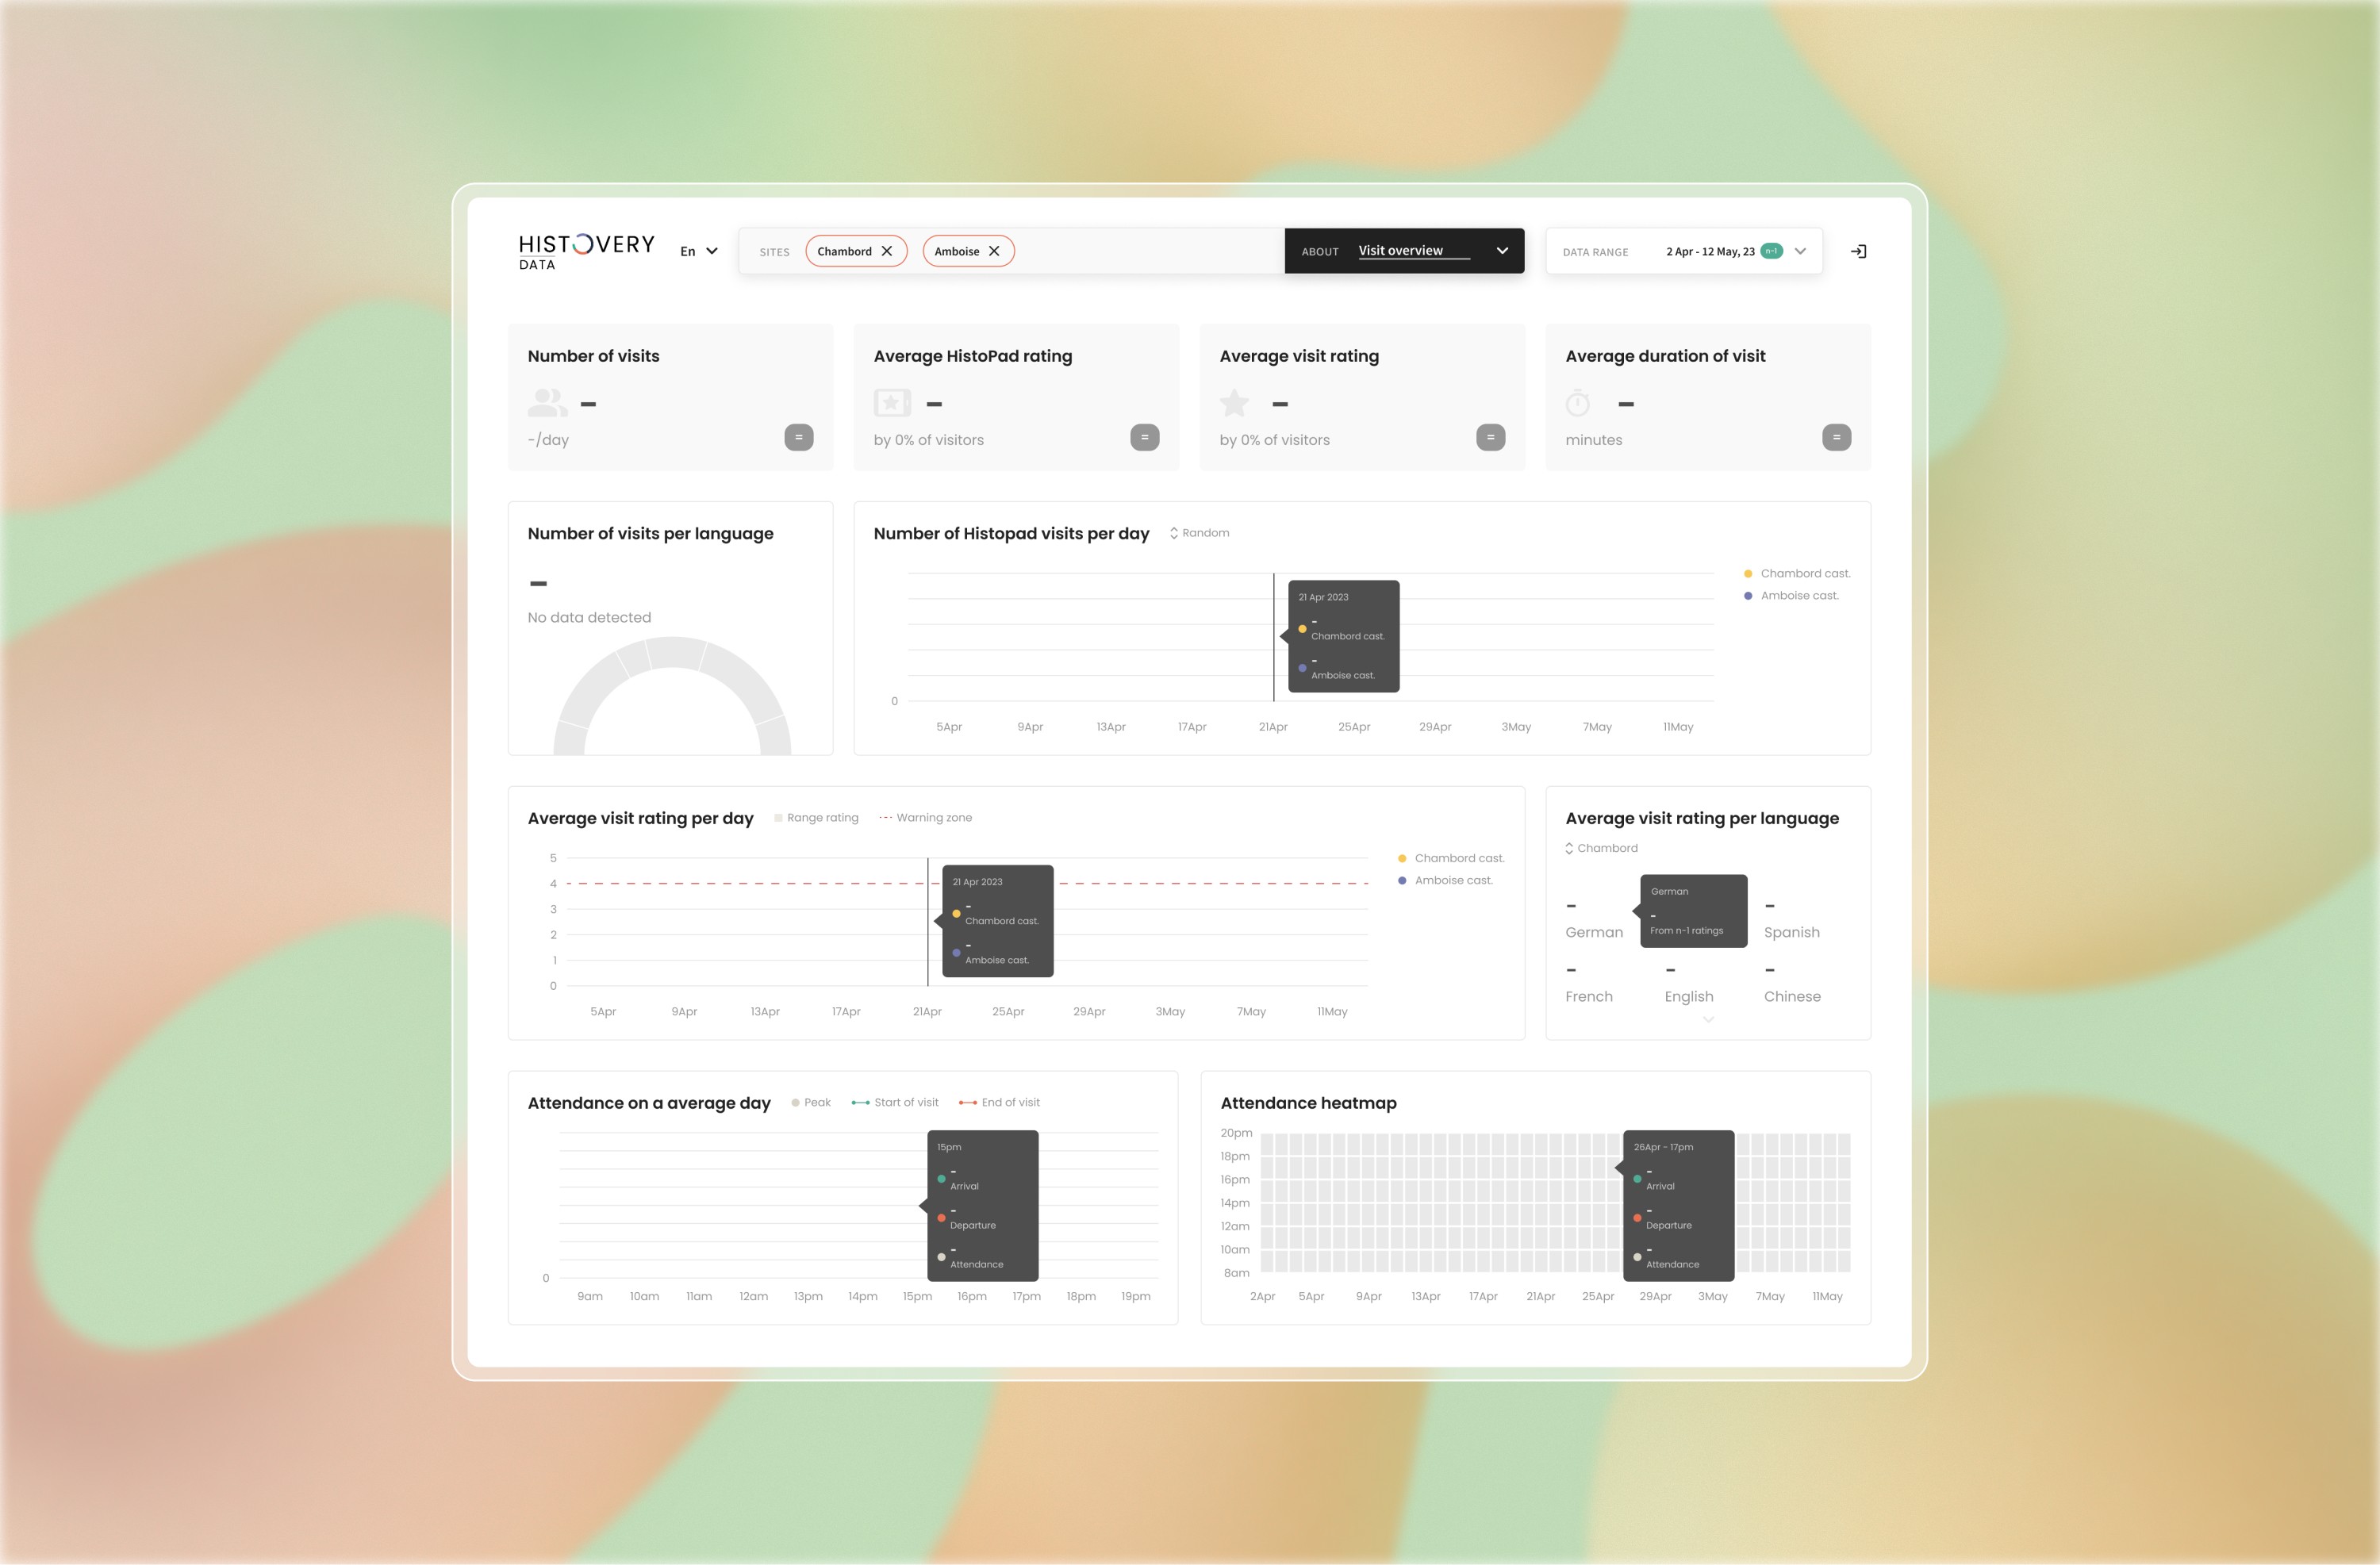
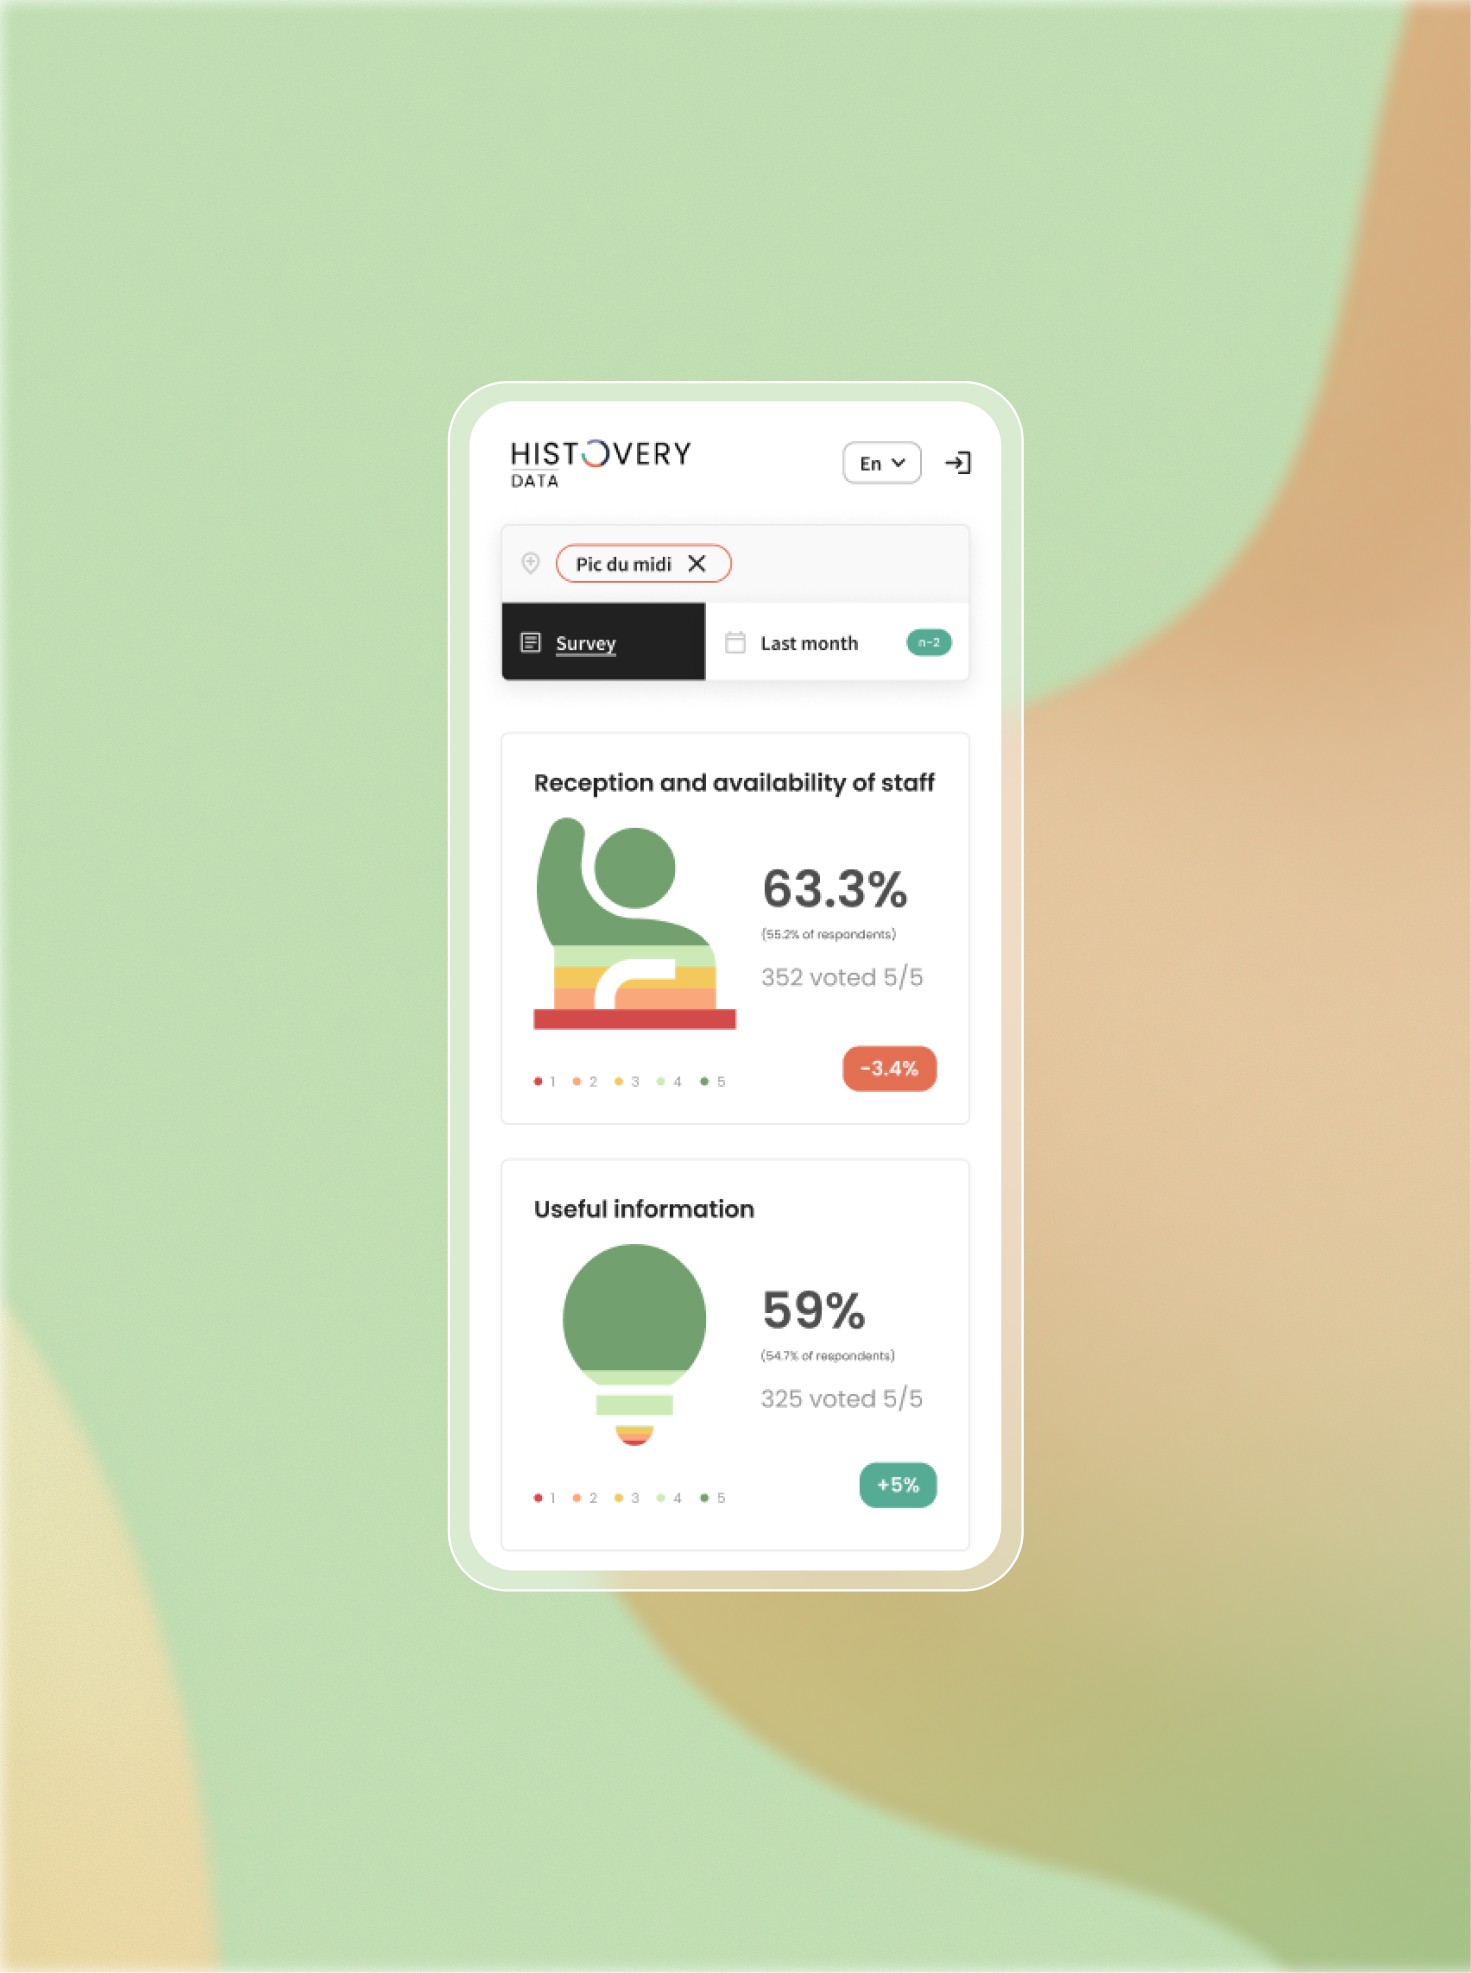
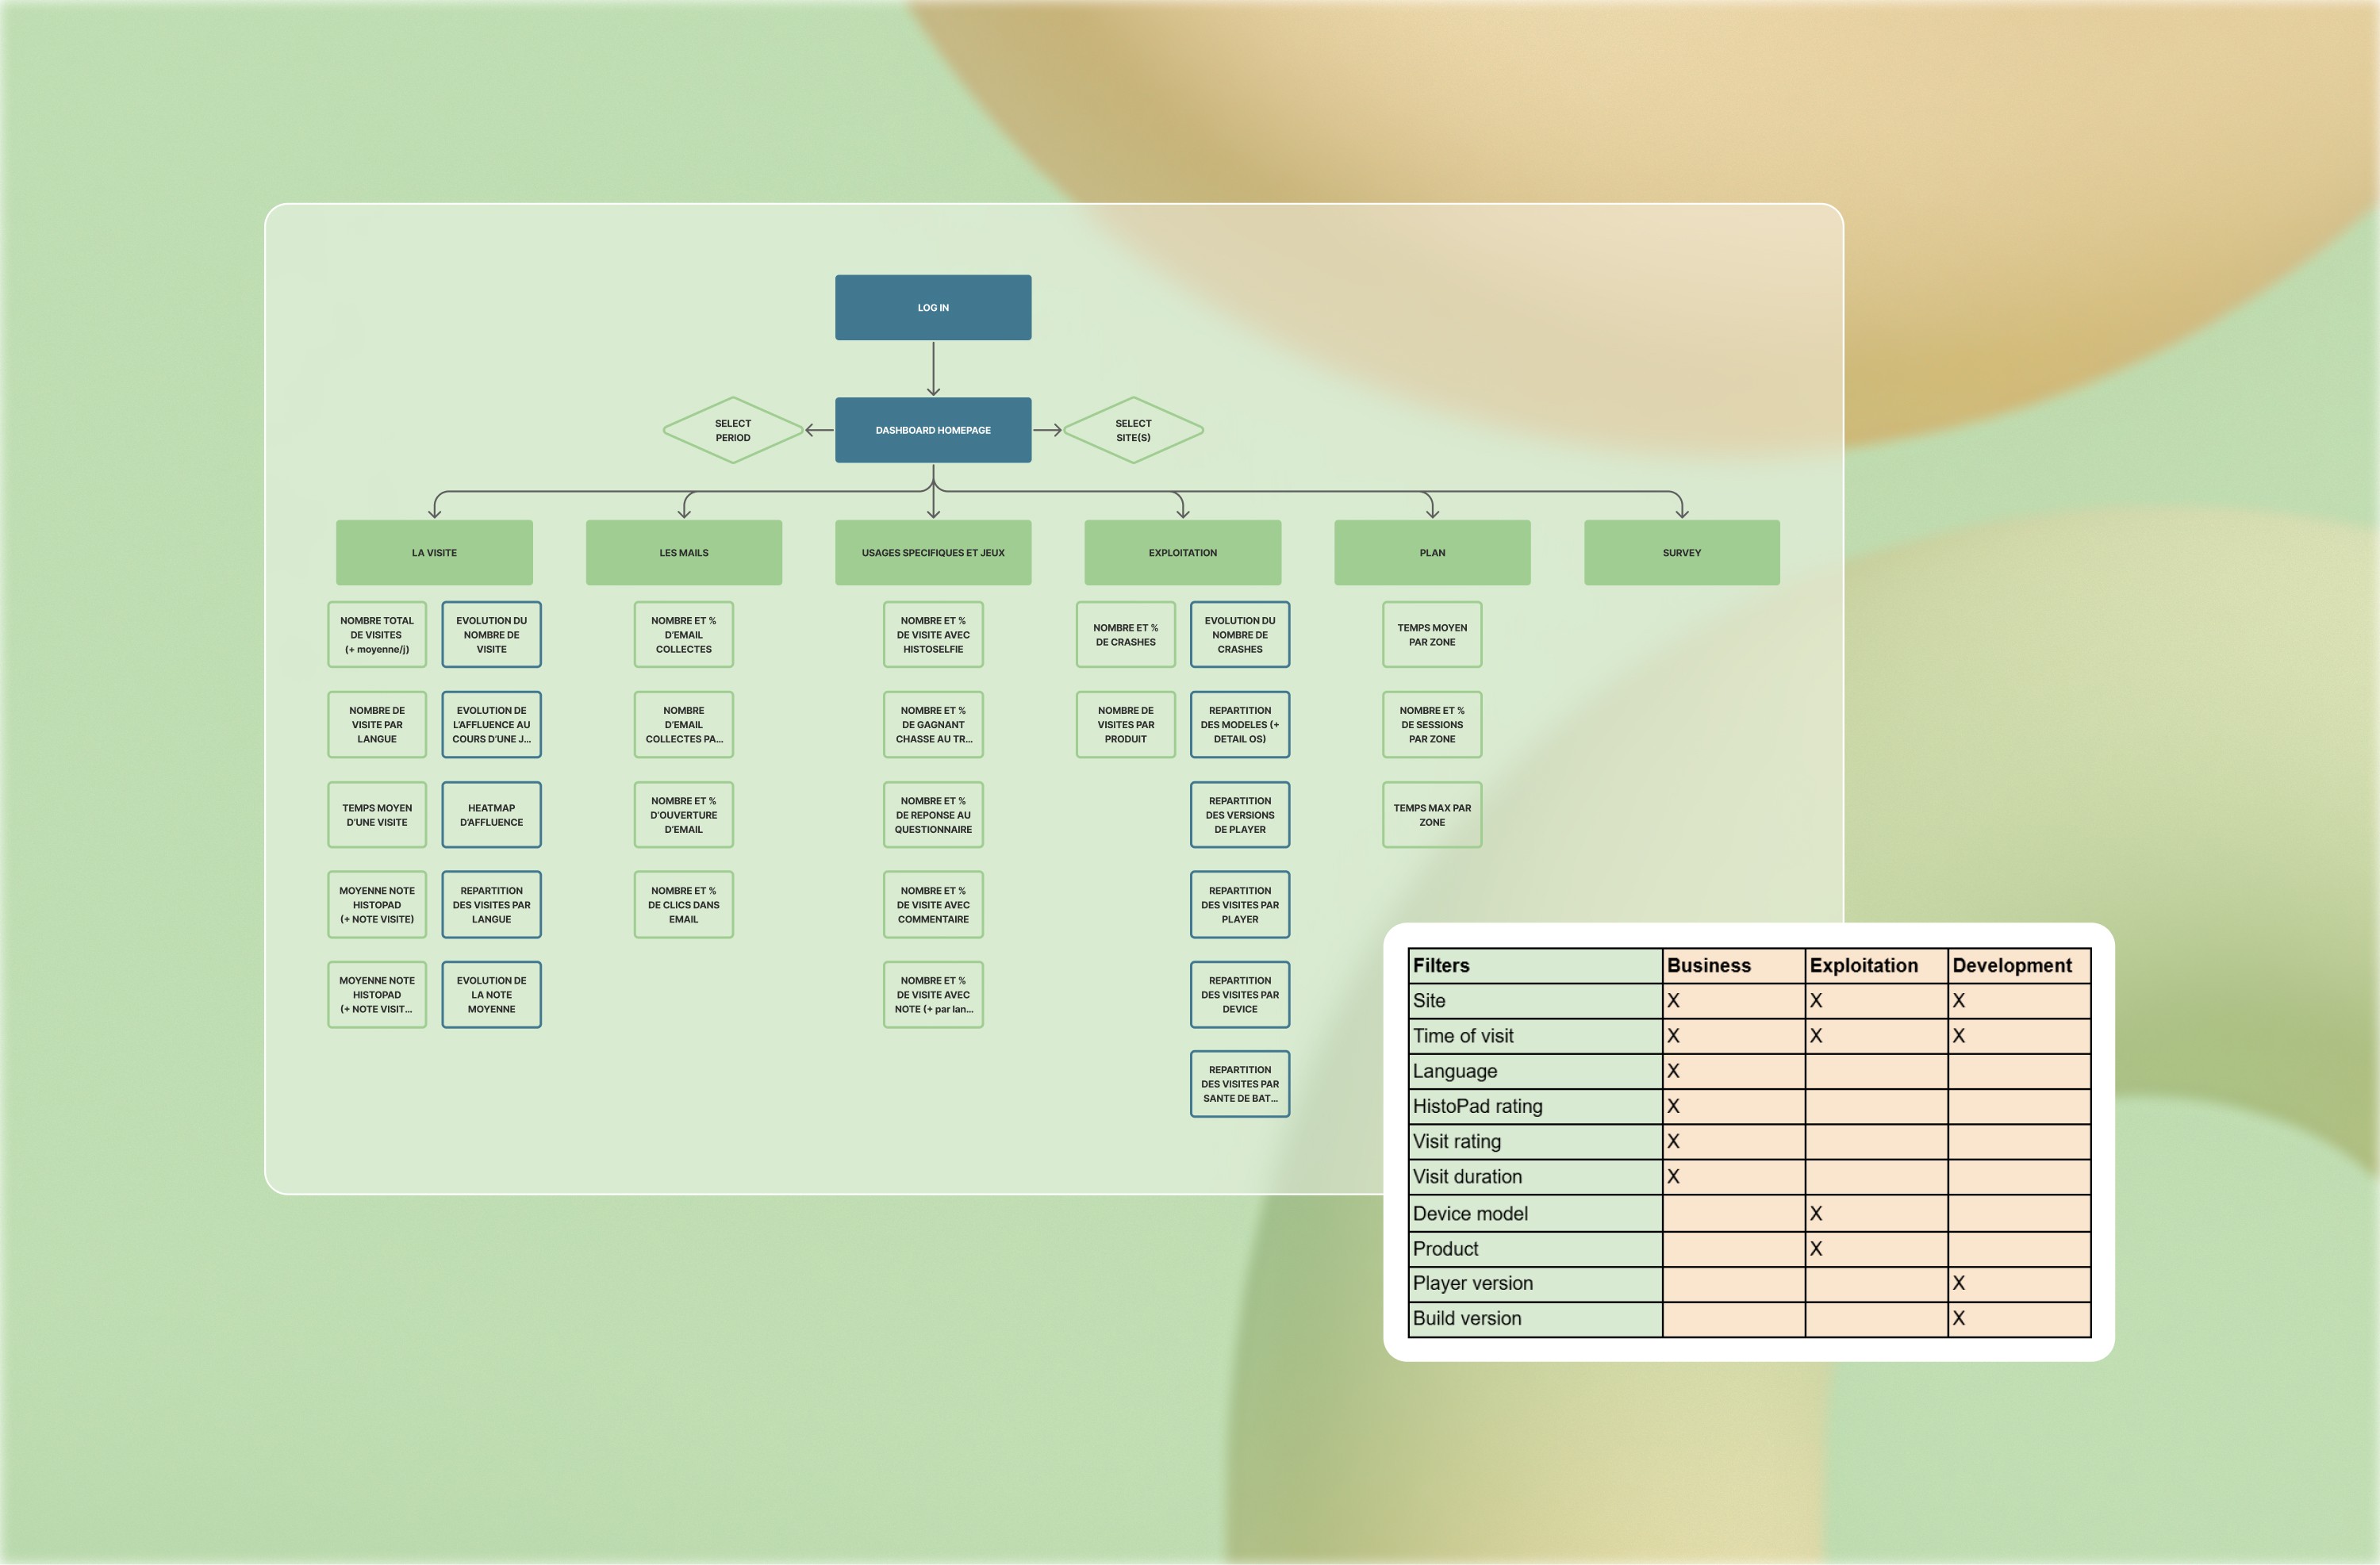
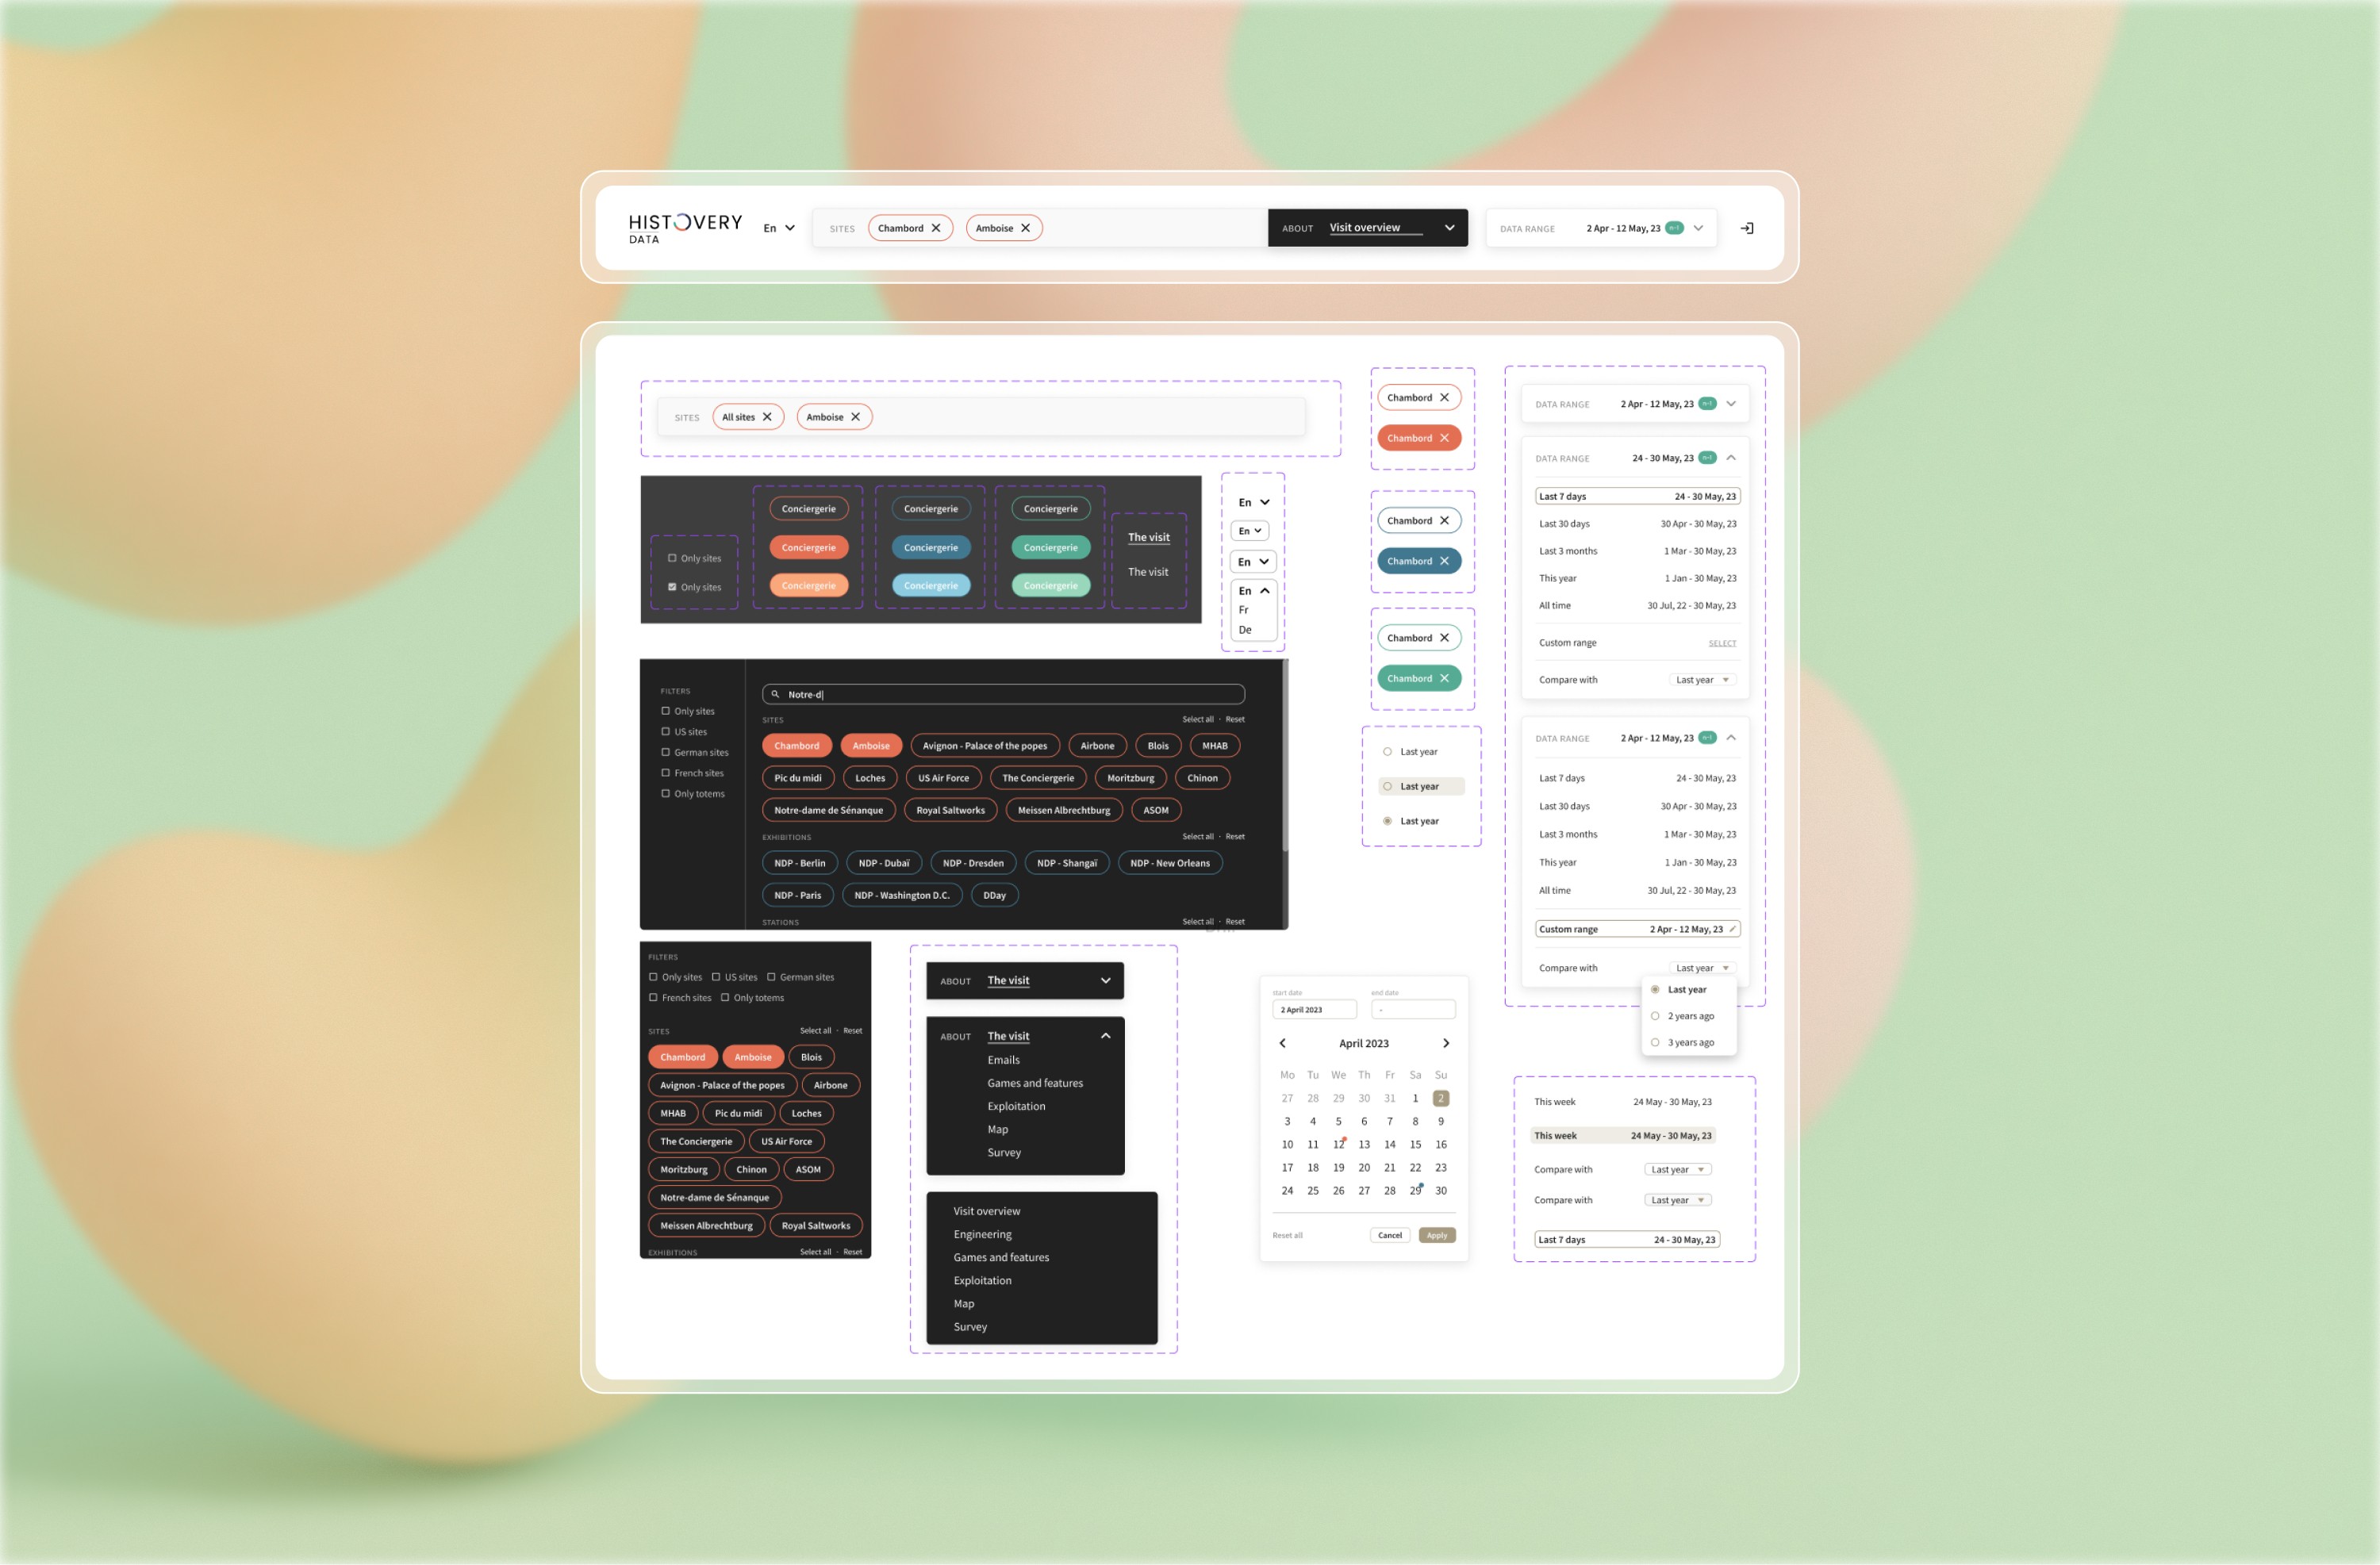
We optimized the architecture of the existing dashboard by interviewing users, modernized the visual identity, and created a modular and scalable system of graph cards.
Challenge
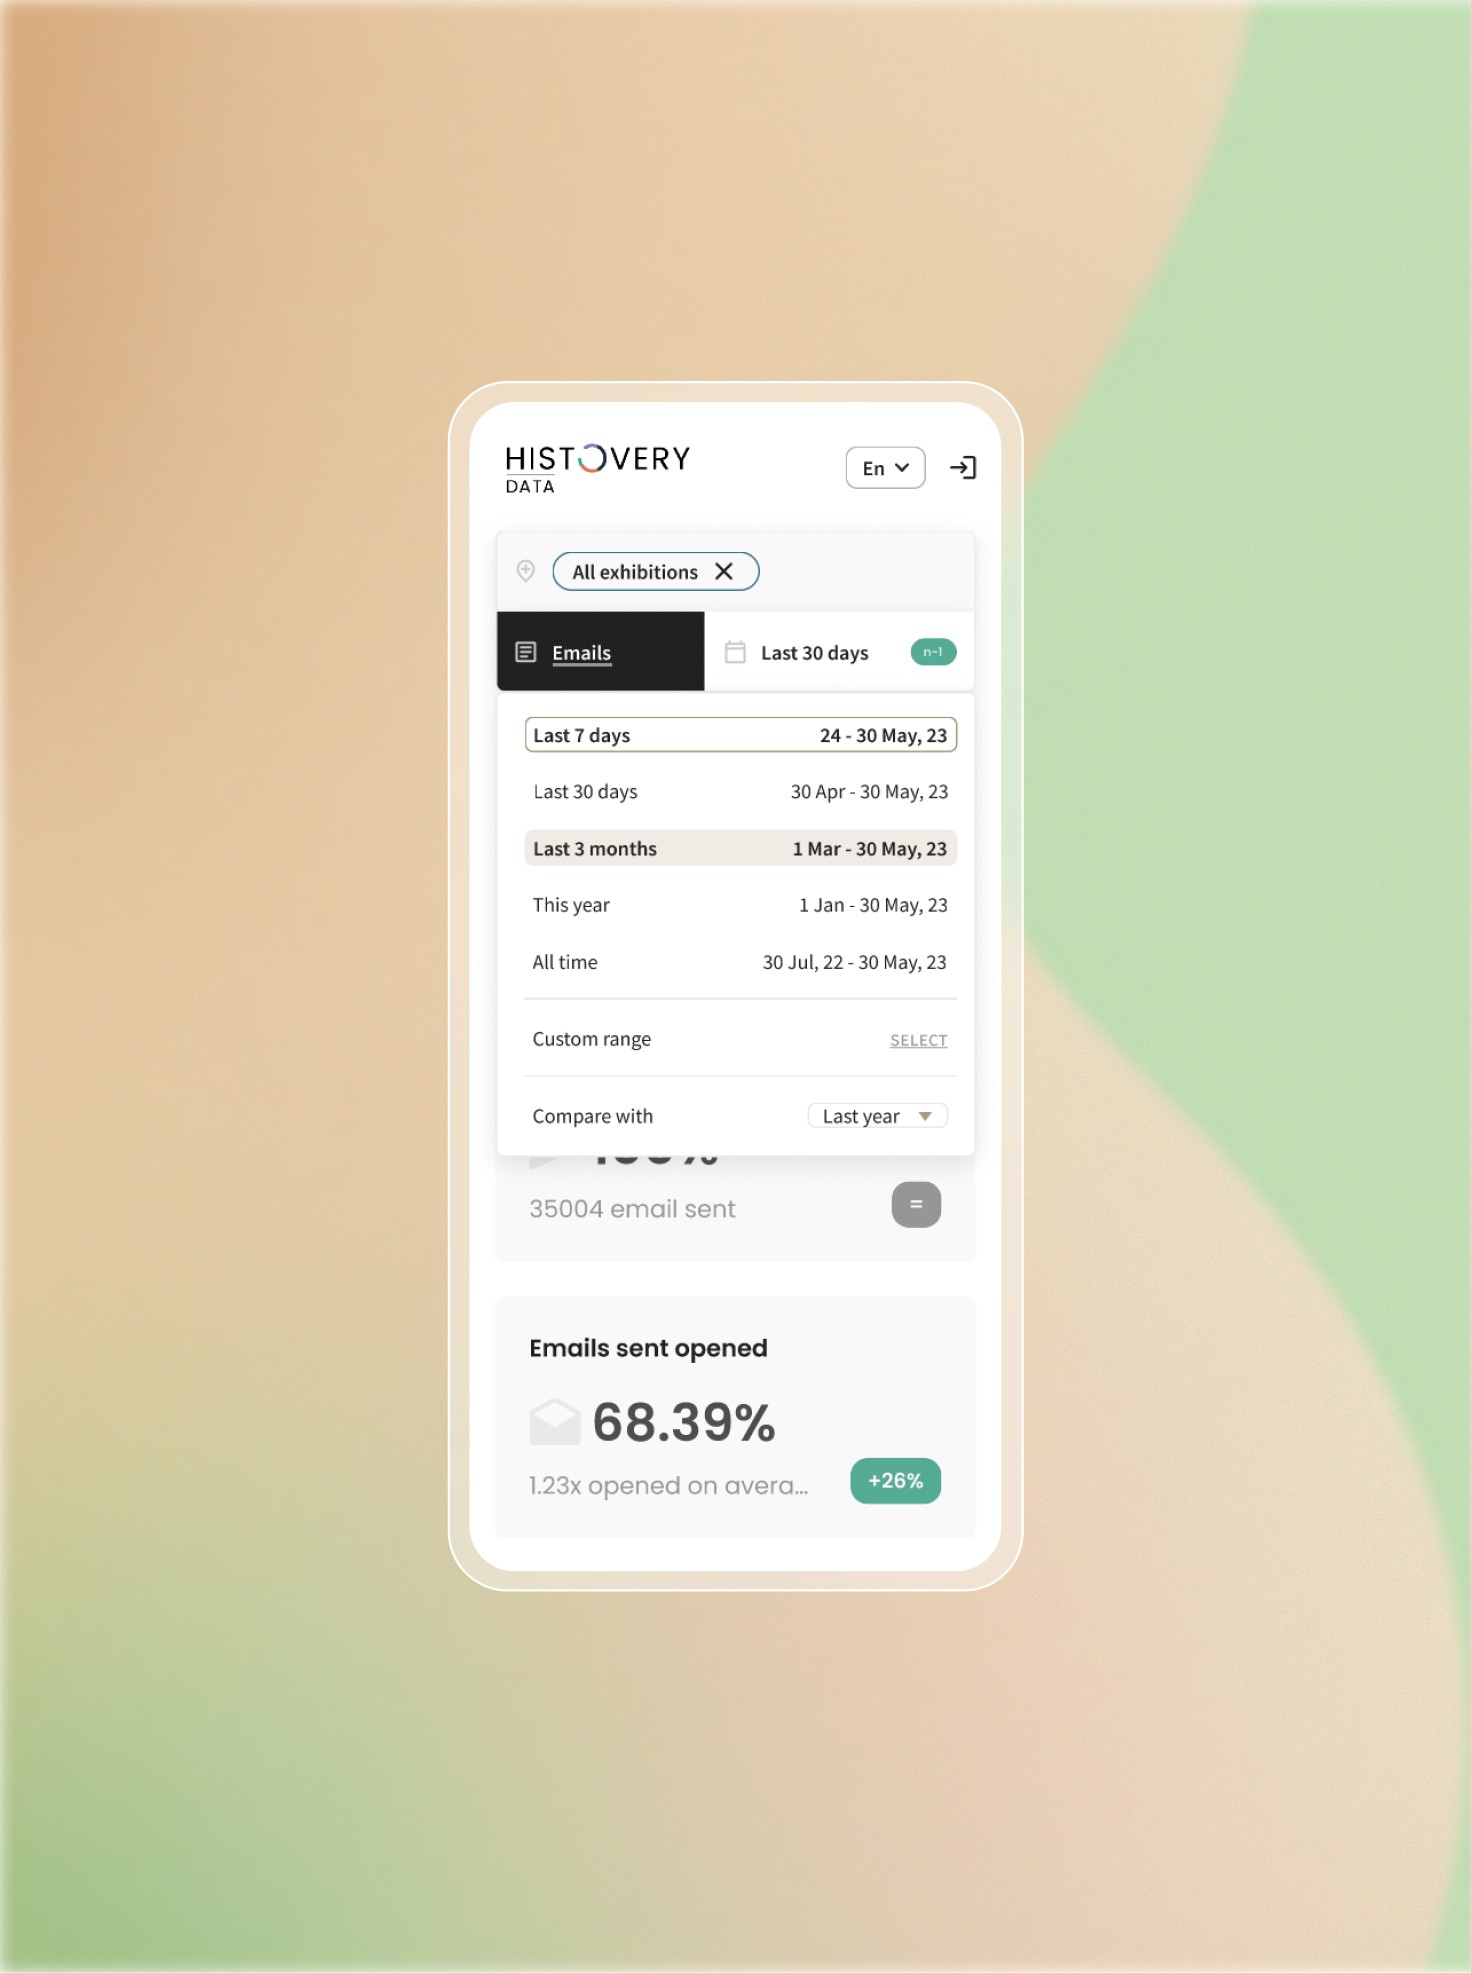
The original dashboard required manual setup for each data display, such as graph type, date range or unit of measurement, making it tedious to use. The goal was to redesign it as a streamlined and standardized tool enabling quick, intuitive comparisons across cultural institutions and time periods.
Process
I first gathered insights into the usage patterns of each user type. This led to the design of an optimized user flow for quick and intuitive global filtering of data samples. I then created a modular design system based on graph cards, enabling the dashboard to be flexible and easily scalable as needs evolve.